RMSE Explained: The Complete Beginner's Guide
What you will learn in this article:
- What Root Mean Squared Error (RMSE) is and why it matters for evaluating predictive models.
- Why squaring errors is a deliberate design choice, not an arbitrary one.
- How to read and interpret an RMSE value in real-world terms.
- The key differences between RMSE and MAE, and when to choose each.
- Common pitfalls practitioners fall into when using RMSE, and how to avoid them.
Introduction
Whenever we build a predictive model, whether it is estimating house prices, forecasting sales figures, or predicting tomorrow's temperature, we need a reliable way to measure how accurate those predictions are. And accuracy is not always straightforward: a model that is always slightly wrong is a very different beast from one that is sometimes perfect but occasionally wildly off.
RMSE, or Root Mean Squared Error, is one of the most widely used metrics for measuring prediction accuracy in regression tasks. It gives you a single, interpretable number that summarizes how far your model's predictions typically are from the real values, expressed in the exact same units as what you are predicting. A model predicting house prices in dollars will have an RMSE measured in dollars. A model predicting temperatures in degrees Celsius will have an RMSE in degrees Celsius. That direct interpretability is one of RMSE's greatest strengths.
Problem Statement
Without a principled error metric, comparing two models is guesswork. Suppose Model A predicts house prices and is usually within a few thousand dollars of the truth, but once in a while it misses by $200,000. Model B is consistently off by about $20,000 on every house. Which is better? The answer depends entirely on what you care about: consistent moderate accuracy, or rare catastrophic failures.
A naive approach, summing all the raw errors, fails immediately because positive and negative errors cancel each other out. A model that over-predicts by $50,000 on one house and under-predicts by $50,000 on another would appear to have zero total error, which is obviously misleading. RMSE was designed to avoid exactly this trap, while also making deliberate choices about how heavily to penalize large errors.
Core Concepts and Terminology
Before diving into how RMSE works, it helps to understand a few terms that appear throughout any discussion of regression metrics.
| Term | Plain-language meaning |
|---|---|
| Prediction error (residual) | The gap between what the model predicted and what actually happened. Positive when the model under-predicted, negative when it over-predicted. |
| Squared error | The prediction error multiplied by itself. Squaring removes the sign and punishes large errors disproportionately. |
| Mean Squared Error (MSE) | The average of all squared errors across the dataset. Useful internally, but expressed in squared units. |
| RMSE | The square root of MSE. This step converts the metric back to the original units of the target variable. |
How It Works
RMSE works by following four conceptual steps, each one solving a specific problem with the previous step.
First, for every data point, the model produces a prediction and you compute the gap: how far off was the model for this specific case? If the model predicted a house price of $260,000 and the house actually sold for $250,000, the error is $10,000 (the model was $10,000 too high).
Second, each error is squared. This achieves two things simultaneously: it makes every error positive (so over- and under-predictions cannot cancel each other out), and it penalizes large errors more heavily than small ones. An error of $20,000 contributes four times as much as an error of $10,000, not twice as much. This is a deliberate choice that makes RMSE sensitive to outliers and catastrophic errors.
Third, all the squared errors are averaged. At this point you have the Mean Squared Error, a useful internal quantity but expressed in squared dollars, which is hard to interpret intuitively.
Fourth, you take the square root of that average. This single step converts the metric back to the original unit (dollars, in the house price example), making the result directly interpretable. If a model has an RMSE of $15,000, you can say: on a typical prediction, the model is about $15,000 away from the truth.
The dart board analogy is useful here. Imagine each prediction is a dart thrown at a target, and the bullseye is the actual value. RMSE is the typical distance of your darts from the centre, but with a twist: darts that miss badly count far more than darts that miss narrowly, because the distances are squared before averaging.
Practical Example
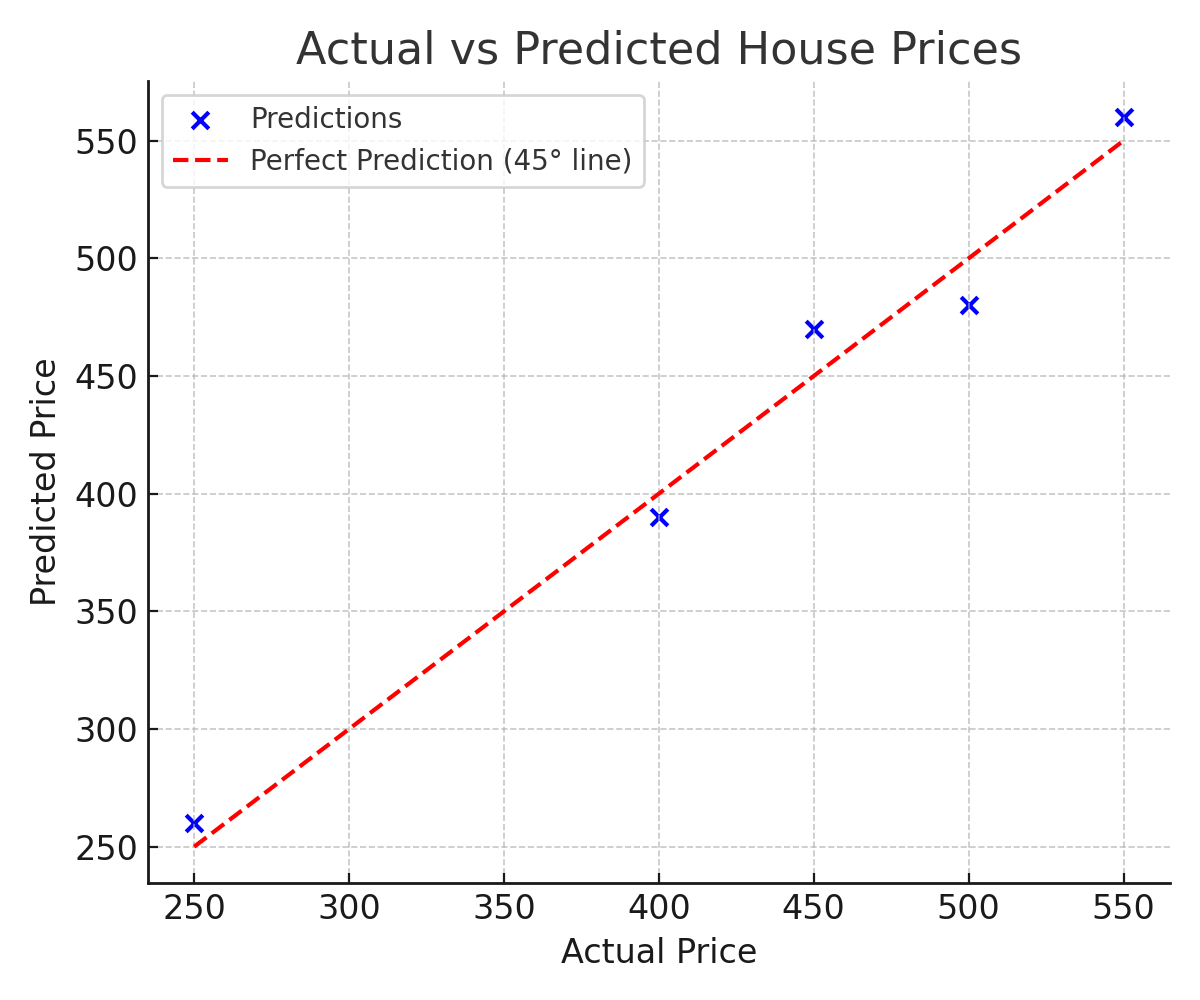
Consider a model predicting prices for five houses. The actual and predicted values (in thousands of dollars) are shown below.
| House | Actual Price | Predicted Price | Error | Squared Error |
|---|---|---|---|---|
| 1 | 250 | 260 | −10 | 100 |
| 2 | 400 | 390 | +10 | 100 |
| 3 | 450 | 470 | −20 | 400 |
| 4 | 500 | 480 | +20 | 400 |
| 5 | 550 | 560 | −10 | 100 |
The five squared errors sum to 1,100. Dividing by 5 gives an MSE of 220. Taking the square root gives an RMSE of approximately 14.83. In plain terms: on a typical prediction, this model is about $14,830 away from the actual house price.
Notice that Houses 3 and 4, each with a $20,000 error, contribute 400 to the squared error total, while Houses 1, 2, and 5, each with a $10,000 error, contribute only 100 each. The larger errors dominate the metric, which is exactly what squaring is designed to achieve.

Advantages
- Same units as the target variable. Because the final step is a square root, RMSE is expressed in the same units as what you are predicting. This makes it directly interpretable to anyone who understands the domain, no unit conversion required.
- Penalizes large errors strongly. By squaring errors before averaging, RMSE gives outsized weight to large mistakes. This is valuable in domains where catastrophic errors carry real consequences, such as financial forecasting, medical dosage prediction, or structural engineering.
- Mathematically convenient. RMSE is differentiable, which makes it well-suited as an optimization objective in gradient-based model training. Many regression models are trained by minimizing MSE (which is equivalent to minimizing RMSE), giving it a natural role throughout the machine learning pipeline.
- Widely understood and reported. RMSE is a standard metric across academic papers, competitions, and industry benchmarks, making it easy to compare your model's performance against published results.
Limitations and Trade-offs
- Sensitive to outliers. Because errors are squared, a single extreme prediction can dramatically inflate RMSE even if the rest of the model's predictions are excellent. In datasets with real outliers, RMSE may give a misleadingly pessimistic picture of overall accuracy.
- Not scale-free. An RMSE of 14.83 means nothing without knowing the scale of the target variable. For a dataset where prices range from $200,000 to $600,000, this is excellent. For a dataset where all prices cluster between $200,000 and $202,000, it is catastrophic. Always contextualize RMSE alongside R² or the range of your data.
- Harder to communicate than MAE. Non-technical stakeholders often find it easier to understand "on average, the model is off by $14,000" (MAE) than the more complex explanation of why RMSE squares and then unsquares errors. For communication purposes, MAE is sometimes simpler.
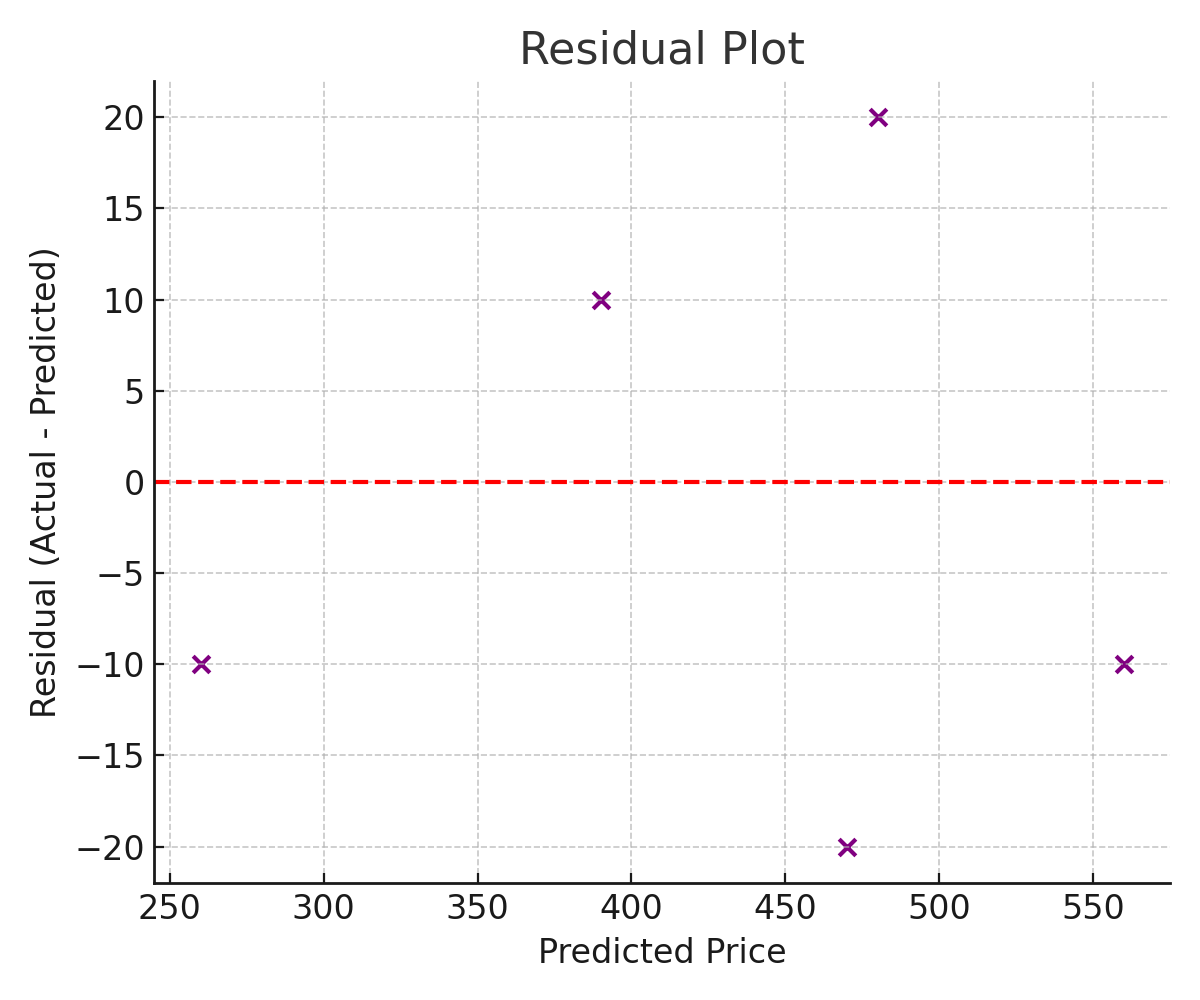
- Does not reveal the direction of errors. RMSE tells you the typical size of errors but says nothing about whether the model tends to over-predict or under-predict. A residual plot is needed to diagnose systematic bias.
Common Mistakes
- Using RMSE in isolation. Reporting only RMSE without also examining residuals, checking for outliers, or comparing to a baseline can give a false sense of confidence. A model with a "decent" RMSE can still be systematically biased or unreliable in specific regions of the data.
- Comparing RMSE across different datasets. RMSE is scale-dependent. An RMSE of 50 on one problem may be excellent, while an RMSE of 50 on a different problem with different-scale targets may be terrible. Only compare RMSE values when the target variables are on the same scale.
- Reporting training RMSE instead of test RMSE. Always evaluate on held-out data. A model that is overfit to the training set can have a very low training RMSE while performing poorly on new data.
- Ignoring outliers in the data. If your dataset contains genuine outlier observations, RMSE will be dominated by those cases. Consider whether those outliers represent legitimate edge cases your model must handle, or whether they should be investigated and potentially removed or treated separately.
Best Practices
- Always report RMSE alongside at least one other metric, such as MAE and R², to give a complete picture of model quality.
- Examine a residual plot alongside RMSE. If residuals show a pattern rather than random scatter, the model has structural problems that a single number cannot reveal.
- Benchmark against a naive baseline. What is the RMSE of a model that always predicts the mean? If your model barely beats that, something is wrong.
- When outliers are a concern, compare RMSE to MAE. If RMSE is substantially larger than MAE, outlier errors are present and deserve investigation.
- Use test-set RMSE, not training-set RMSE, for any final performance claims.
Comparison with Related Metrics
| Metric | What it measures | Units | Sensitivity to outliers | Best used when |
|---|---|---|---|---|
| RMSE | Square root of average squared error | Same as target | High (squares errors) | Large errors are especially costly |
| MAE | Average absolute error | Same as target | Low (no squaring) | All errors are equally important; outliers exist |
| MSE | Average squared error | Squared target units | High | Optimization objective during training |
| R² | Proportion of variance explained | Unitless (0 to 1) | Moderate | Comparing models across different data scales |
The relationship between RMSE and MAE is particularly telling. When the two values are close together, your errors are roughly uniform in size. When RMSE is substantially larger than MAE, it signals that a few large errors are pulling the metric up, and those cases deserve closer investigation.
FAQ
What is a "good" RMSE value?
There is no universal answer. A good RMSE is one that is small relative to the range or variability of the target variable. Dividing RMSE by the mean of the target (to get a percentage) or comparing it against the standard deviation of the target gives useful context. Always also compare against a naive baseline such as always predicting the mean.
Why use RMSE instead of just MAE?
RMSE should be preferred when large errors are disproportionately costly. Squaring gives heavy weight to big mistakes, so a model optimized for RMSE will work harder to avoid extreme errors. MAE treats all errors proportionally, so it is better when you genuinely want an average measure of error without penalizing outliers extra.
Is RMSE the same as standard deviation?
They are structurally similar but measure different things. Standard deviation measures how far individual data points are from their mean. RMSE measures how far predictions are from actual values. If the model always predicted the mean of the target variable, RMSE would equal the standard deviation of the target. In practice, a good model should have an RMSE well below that standard deviation.
Can RMSE be negative?
No. Because errors are squared before averaging, and square roots of non-negative numbers are non-negative, RMSE is always zero or positive. An RMSE of zero means the model predicted every value perfectly.
Should I use RMSE or MSE during model training?
For optimization purposes, MSE and RMSE are equivalent: minimizing one minimizes the other, because the square root is a monotonically increasing function. MSE is usually preferred as a training loss because it is simpler to compute derivatives from. RMSE is preferred for reporting because it is in interpretable units.
References
- Statistics by Jim: Root Mean Square Error (RMSE)
- Wikipedia: Mean Squared Error
- Wikipedia: Root Mean Square Deviation
- Copernicus GMD: RMSE vs. MAE Discussion
- Gauss, C.F. (1809). Theoria Motus Corporum Coelestium. Perthes and Besser.
- James, G., Witten, D., Hastie, T., & Tibshirani, R. (2021). An Introduction to Statistical Learning (2nd ed.). Springer.
Key Takeaways
- RMSE expresses typical prediction error in the same units as the target variable, making it directly interpretable.
- Squaring errors before averaging means large mistakes are penalized far more heavily than small ones, a deliberate and useful design choice.
- Lower RMSE means better model performance; an RMSE of zero would mean every prediction is perfect.
- RMSE is sensitive to outliers: a single extreme error can significantly inflate the metric even when most predictions are good.
- Always pair RMSE with MAE and R² to get a complete picture, and always validate on held-out test data, not the training set.
- When RMSE is much larger than MAE, investigate the outlier predictions, they are the story behind the number.
Related Articles