A Beginner's Guide to Mean Absolute Error (MAE)
What you will learn in this article:
- What Mean Absolute Error (MAE) is and why it is one of the most intuitive regression metrics available.
- How MAE treats all prediction errors equally, regardless of their size.
- The key difference between MAE and RMSE, and how to choose between them.
- When MAE is the right metric to use, and when it is not.
- Common mistakes practitioners make with MAE, and how to avoid them.
Introduction
Imagine you are a weather forecaster and your model predicted temperatures of 22°C, 18°C, and 25°C on three consecutive days. The actual temperatures turned out to be 20°C, 20°C, and 23°C. How do you communicate, in a single meaningful number, how wrong your model was across all three days?
One natural and powerful answer: measure the gap on each day, ignore whether the model was too high or too low, and take the average of those gaps. That is exactly what Mean Absolute Error (MAE) does. It answers a deceptively simple question: on average, by how much do my predictions miss the truth? And it answers it in the same units as what you are predicting, degrees for temperature, dollars for price, days for delivery time.
This directness and interpretability make MAE one of the most widely reported metrics in applied data science, alongside RMSE and R².
Problem Statement
When a model makes predictions, it will rarely be exactly right. The question is how to summarize the collective wrongness across many predictions into a single, actionable number. Several approaches are possible, each with different properties.
The simplest idea, summing all prediction errors, fails because positive errors (over-predictions) and negative errors (under-predictions) cancel out. A model that is $50,000 too high on one house and $50,000 too low on another would appear to have zero total error. That is obviously wrong.
RMSE addresses this by squaring errors before averaging, but squaring has a side effect: large errors receive disproportionately more weight than small ones. In many practical situations, this is not what you want. If you are measuring a model's typical performance, you may want every error counted proportionally to its actual size, not amplified by squaring. MAE provides exactly that: a simple, proportional, sign-free average of how far off the model typically is.
Core Concepts and Terminology
| Term | Plain-language meaning |
|---|---|
| Prediction error | The gap between the actual value and the model's prediction for a specific case. Can be positive or negative. |
| Absolute error | The prediction error with the sign removed. A miss of 10 in either direction is counted as 10. |
| MAE | The average of all absolute errors. Expresses how far off the model typically is, in the same units as the target. |
| RMSE | The square root of the average squared error. Penalizes large errors more than MAE does due to squaring. |
How It Works
MAE works through three straightforward steps, each one solving a clear problem.
First, for every prediction the model makes, compute the gap between the actual value and the predicted value. If the model predicted a house price of $260,000 and the house actually sold for $250,000, the error is $10,000. If another house sold for $500,000 and the model predicted $480,000, the error is $20,000. Errors can be positive or negative depending on the direction of the miss.
Second, take the absolute value of each error. This removes the sign: a prediction that was $10,000 too high and a prediction that was $10,000 too low both become simply $10,000. Over-predictions and under-predictions are treated identically in terms of their contribution to MAE. This is a deliberate design choice that reflects the idea that a miss of a given size is equally bad regardless of direction.
Third, average all the absolute errors. The result is a single number expressed in the same units as the target variable. If that number is $14,000, you can say directly: on a typical prediction, this model is about $14,000 away from the actual house price.

Practical Example
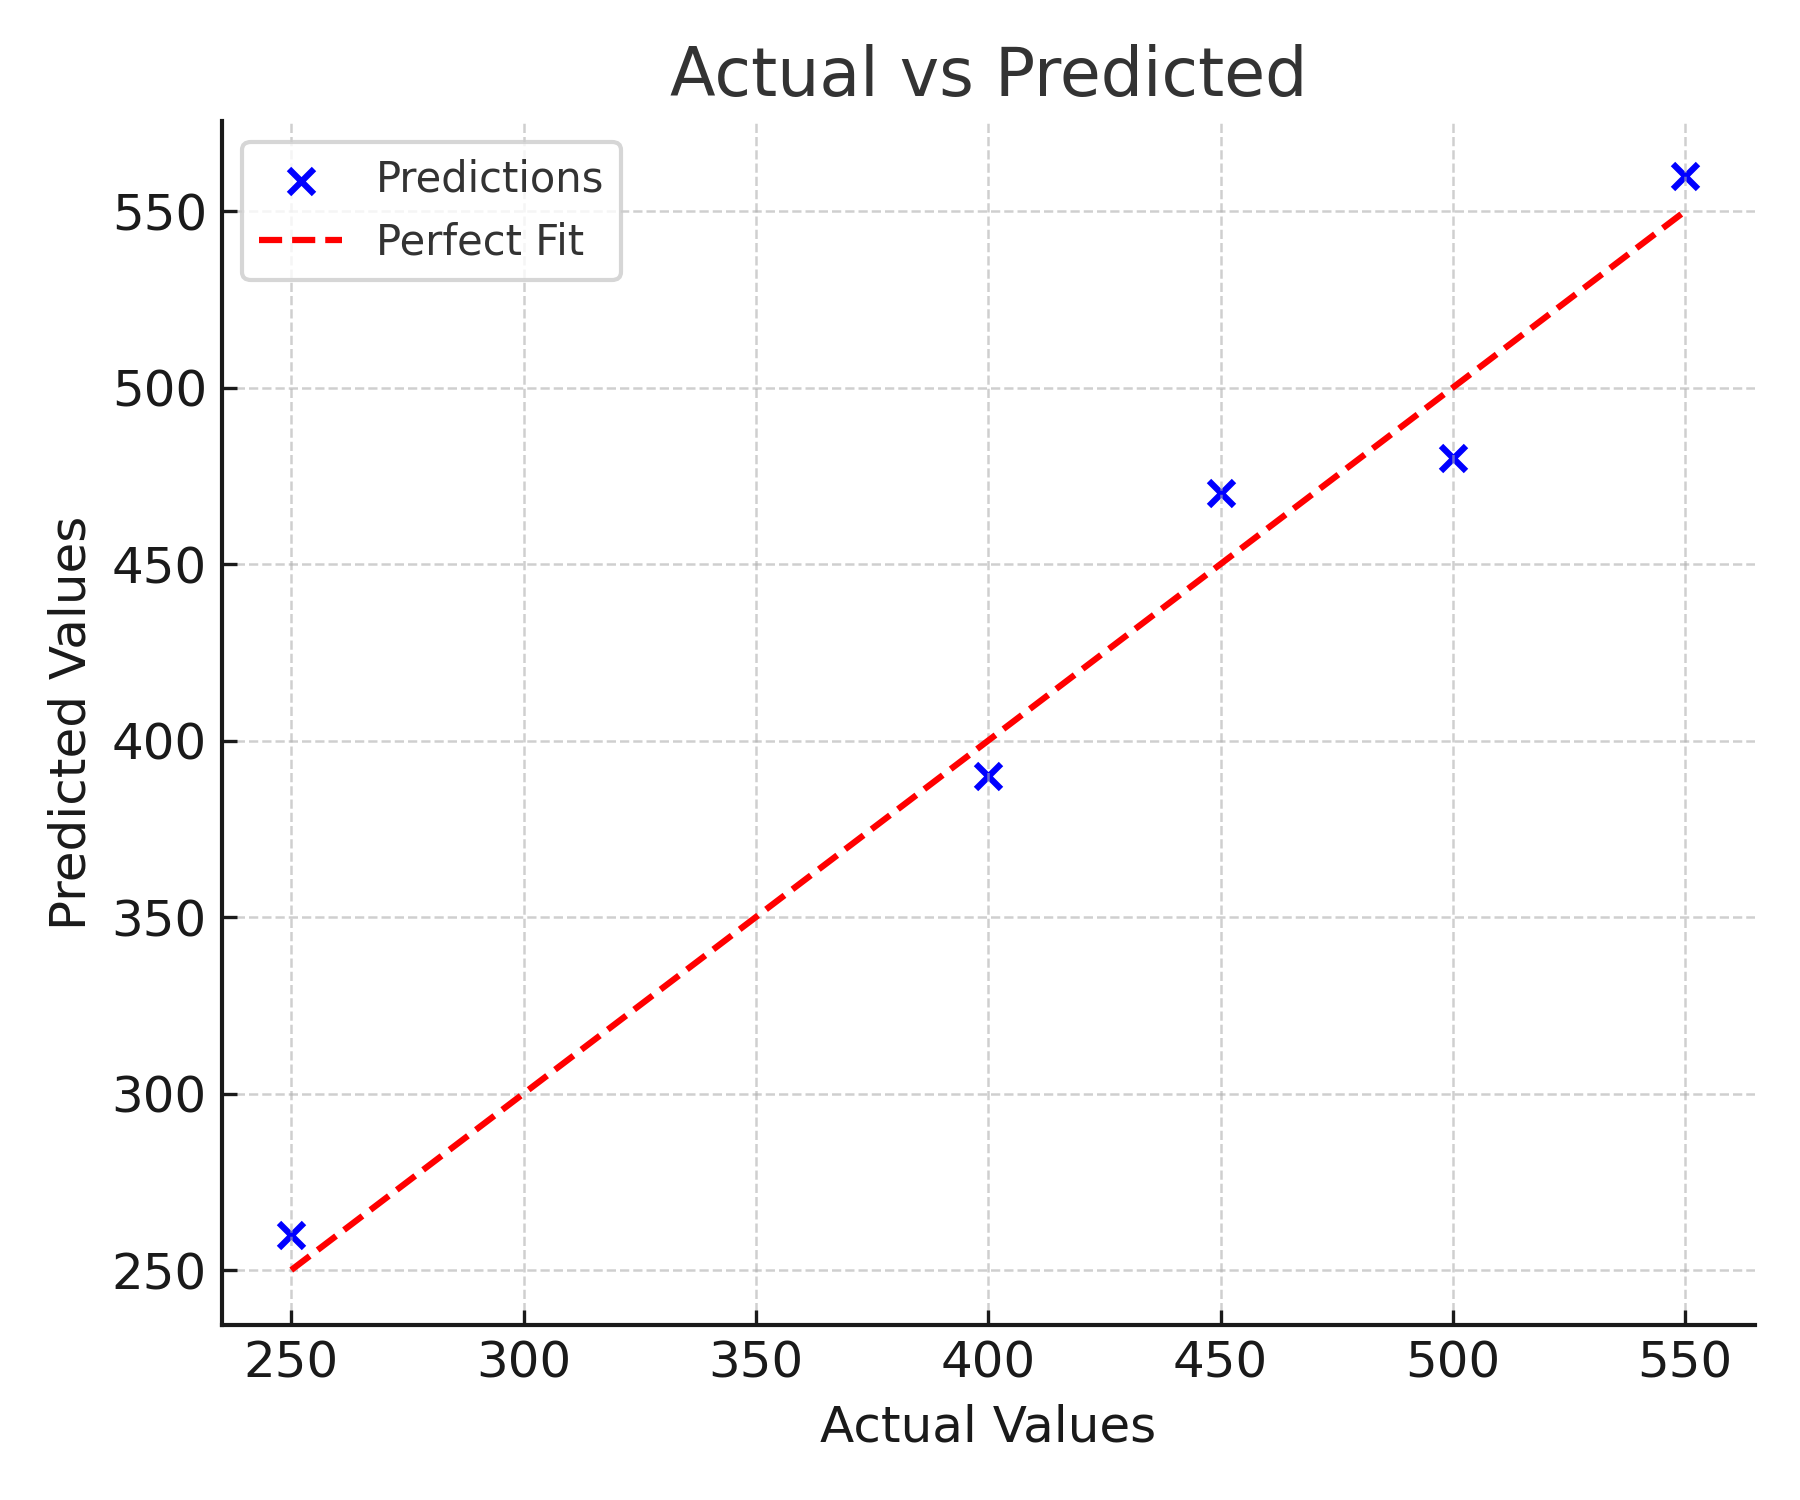
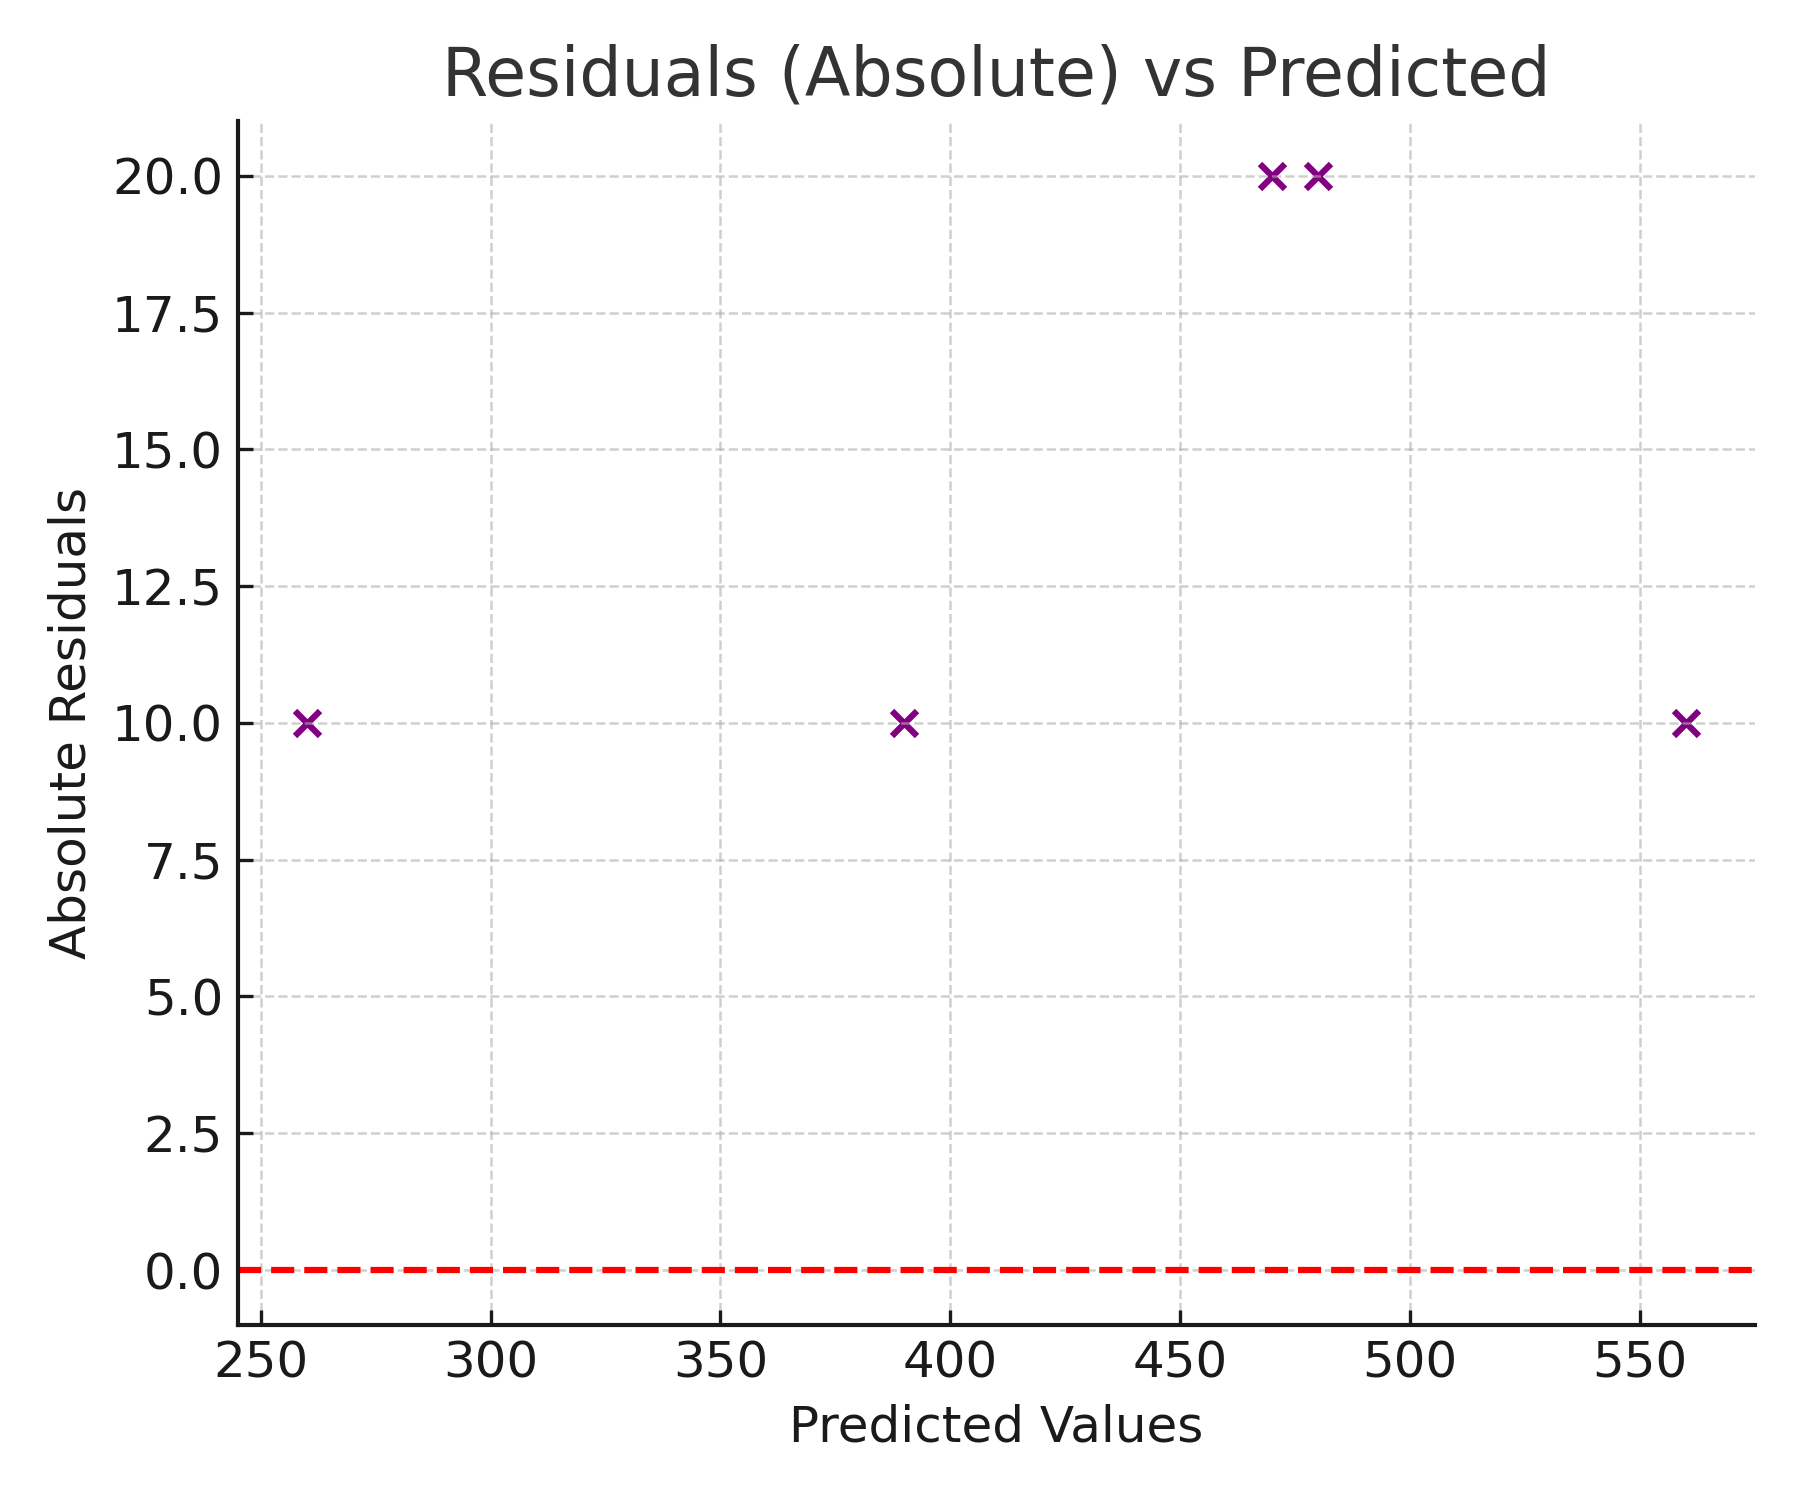
Consider a model predicting house prices for five properties. The actual prices, predicted prices, and absolute errors (all in thousands of dollars) are shown below.
| House | Actual Price | Predicted Price | Absolute Error |
|---|---|---|---|
| 1 | 250 | 260 | 10 |
| 2 | 400 | 390 | 10 |
| 3 | 450 | 470 | 20 |
| 4 | 500 | 480 | 20 |
| 5 | 550 | 560 | 10 |
The five absolute errors sum to 70. Dividing by 5 gives an MAE of 14. In plain terms: on a typical prediction, this model is about $14,000 away from the actual house price.
Notice how straightforward this interpretation is. There are no squared units to convert back from, no abstract proportions to explain. The number speaks directly in the language of the problem.
Also notice how Houses 3 and 4, with $20,000 errors, contribute twice as much as Houses 1, 2, and 5, with $10,000 errors. This is the proportional treatment that defines MAE: a mistake twice as large counts exactly twice as much, not four times as much as it would under RMSE.
Advantages
- Direct interpretability. MAE is expressed in the same units as the target variable, and it has a natural, everyday meaning. An MAE of $14,000 in a house price model is immediately understandable to any stakeholder without statistical training.
- Robustness to outliers. Because MAE does not square errors, extreme predictions have less influence on the metric than they do on RMSE. A single outlier will raise MAE proportionally to its error size, not exponentially. This makes MAE a more stable measure of typical performance when the dataset contains genuine outliers.
- Equal treatment of all errors. Every unit of error counts equally in MAE. A 20-unit miss counts exactly twice as much as a 10-unit miss. This proportional treatment is appropriate in any context where there is no reason to penalize large errors more than their actual size warrants.
- Easy to explain to non-technical audiences. "On average, our model is off by $14,000" is a compelling and accurate description that requires no background in statistics. This makes MAE particularly useful for communicating model performance in business settings.
Limitations and Trade-offs
- Does not penalize large errors heavily enough in some domains. In applications where a catastrophic prediction error carries severe real-world consequences, such as medical dosage prediction or structural load estimation, MAE may understate the risk. RMSE's squaring ensures large errors receive outsized attention, which is appropriate when large errors are unusually costly.
- Less mathematically convenient for optimization. The absolute value function has a kink at zero and is not differentiable there. This makes MAE harder to minimize analytically than MSE or RMSE, which are smooth and differentiable everywhere. MAE as a training loss requires more sophisticated optimization approaches.
- Does not reveal error direction. Like RMSE, MAE tells you how large the errors are on average, but not whether the model systematically over-predicts or under-predicts. Residual analysis is needed to diagnose directional bias.
- Scale-dependent. MAE depends on the scale of the target variable, which makes it difficult to compare across different prediction tasks without normalization. R² is a better choice when scale-free comparison is needed.
Common Mistakes
- Choosing MAE versus RMSE without thinking about what the metric should reflect. Many practitioners default to RMSE out of convention. But if your problem genuinely does not warrant extra punishment for large errors, and if your data has outliers you do not want to dominate the metric, MAE is often the better choice. The decision should be deliberate.
- Reporting MAE without comparing it to the scale of the target. An MAE of 14 is only meaningful when you know the range of prices. If all prices are between $200,000 and $600,000, an MAE of $14,000 is excellent. If prices are between $195,000 and $205,000, the same MAE is terrible. Always contextualize.
- Using MAE on the training set instead of the test set. Training MAE is almost always lower than test MAE due to overfitting. Report test-set MAE as the measure of real model performance.
- Treating MAE and RMSE as interchangeable. They measure different things. If MAE and RMSE are similar, errors are roughly uniform across the dataset. If RMSE is much larger than MAE, a few large errors are dominating the RMSE but getting averaged away in MAE. That discrepancy is itself important information.
Best Practices
- Report MAE and RMSE together. The gap between them is informative: a large gap signals the presence of significant outlier errors that MAE is muting.
- Choose MAE as your primary metric when interpretability is the top priority, when the dataset contains real outliers you do not want dominating the evaluation, or when all errors are genuinely equally important regardless of size.
- Always evaluate on a held-out test set, not the training data.
- Compare MAE to a naive baseline: what is the MAE if you always predict the mean? If your model barely improves on that, investigate further.
- Pair MAE with a residual plot to check whether the model has directional bias that the magnitude-only metric cannot reveal.
Comparison with Related Metrics
| Metric | How errors are combined | Outlier sensitivity | Units | Best used when |
|---|---|---|---|---|
| MAE | Average of absolute errors | Low: outliers counted proportionally | Same as target | Interpretability matters; outliers should not dominate |
| RMSE | Square root of average squared errors | High: large errors amplified by squaring | Same as target | Large errors are especially costly; outliers deserve extra weight |
| MSE | Average of squared errors | High | Squared target units | Training objective; not for direct reporting |
| R² | Proportion of variance explained | Moderate | Unitless (0 to 1) | Scale-free comparison of fit quality across different problems |
The comparison between MAE and RMSE is particularly informative in practice. When the two numbers are close, the errors in your dataset are roughly uniform in size. When RMSE significantly exceeds MAE, you have a distribution of errors with a long tail: most predictions are reasonably accurate, but a few are dramatically wrong. Those cases deserve investigation regardless of which metric you report.
FAQ
When should I choose MAE over RMSE?
Choose MAE when all errors are genuinely equally important regardless of size, when your dataset contains real outliers that reflect noise rather than meaningful extreme cases, or when you need to communicate results to a non-technical audience in clear, immediately interpretable terms. Choose RMSE when large errors carry disproportionately high real-world consequences and you want the metric to reflect that.
What is a "good" MAE?
There is no universal threshold. A good MAE is one that is small relative to the typical magnitude and range of the target variable. Dividing MAE by the mean of the target (to express it as a percentage) or comparing it to the standard deviation of the target provides useful context. Always compare against a naive baseline such as always predicting the mean.
Can MAE be negative?
No. Absolute values are always non-negative, so MAE is always zero or positive. An MAE of zero would mean every prediction was exactly right.
Is MAE or RMSE better for model selection?
Neither is universally better. If you care about minimizing typical errors and your data has outliers you do not want to over-weight, MAE gives a fairer picture. If you care about avoiding extreme errors and want large mistakes to pull the metric up noticeably, RMSE is the better guide. In practice, examine both: the relationship between them reveals important characteristics of the error distribution.
Why does MAE equal the median prediction error under certain conditions?
Minimizing MAE over a dataset is equivalent to predicting the median of the target distribution, rather than the mean. Strictly speaking, this holds for a constant (intercept-only) predictor: the single value that minimizes total absolute error is the median of the targets. For a full regression model with features, minimizing MAE yields conditional median estimates rather than the unconditional median of the whole dataset — the relationship is more nuanced in that setting. This is a lesser-known but important property that makes MAE particularly natural when the target distribution is skewed or heavy-tailed, where the median is a more representative central value than the mean.
References
- Scikit-learn Documentation: Mean Absolute Error
- Wikipedia: Mean Absolute Error
- James, G., Witten, D., Hastie, T., & Tibshirani, R. (2021). An Introduction to Statistical Learning (2nd ed.). Springer.
- Willmott, C.J., & Matsuura, K. (2005). Advantages of the mean absolute error (MAE) over the root mean square error (RMSE) in assessing average model performance. Climate Research, 30(1), 79–82.
Key Takeaways
- MAE is the average absolute gap between predictions and actual values, expressed in the same units as the target variable.
- It treats all errors proportionally: a mistake twice as large counts exactly twice as much, not four times as much.
- MAE is robust to outliers: extreme errors influence the metric only in proportion to their actual size, not exponentially.
- Use MAE when interpretability is the priority, when outliers should not dominate the evaluation, or when all prediction errors are genuinely equally important.
- Compare MAE to RMSE: a large gap between the two reveals that outlier errors are present and may warrant investigation.
- Always validate on held-out test data and pair MAE with a residual plot to check for systematic directional bias.
Related Articles